3D Waveforms
強震波形の立体化
- Data Sculpture
- Visualization
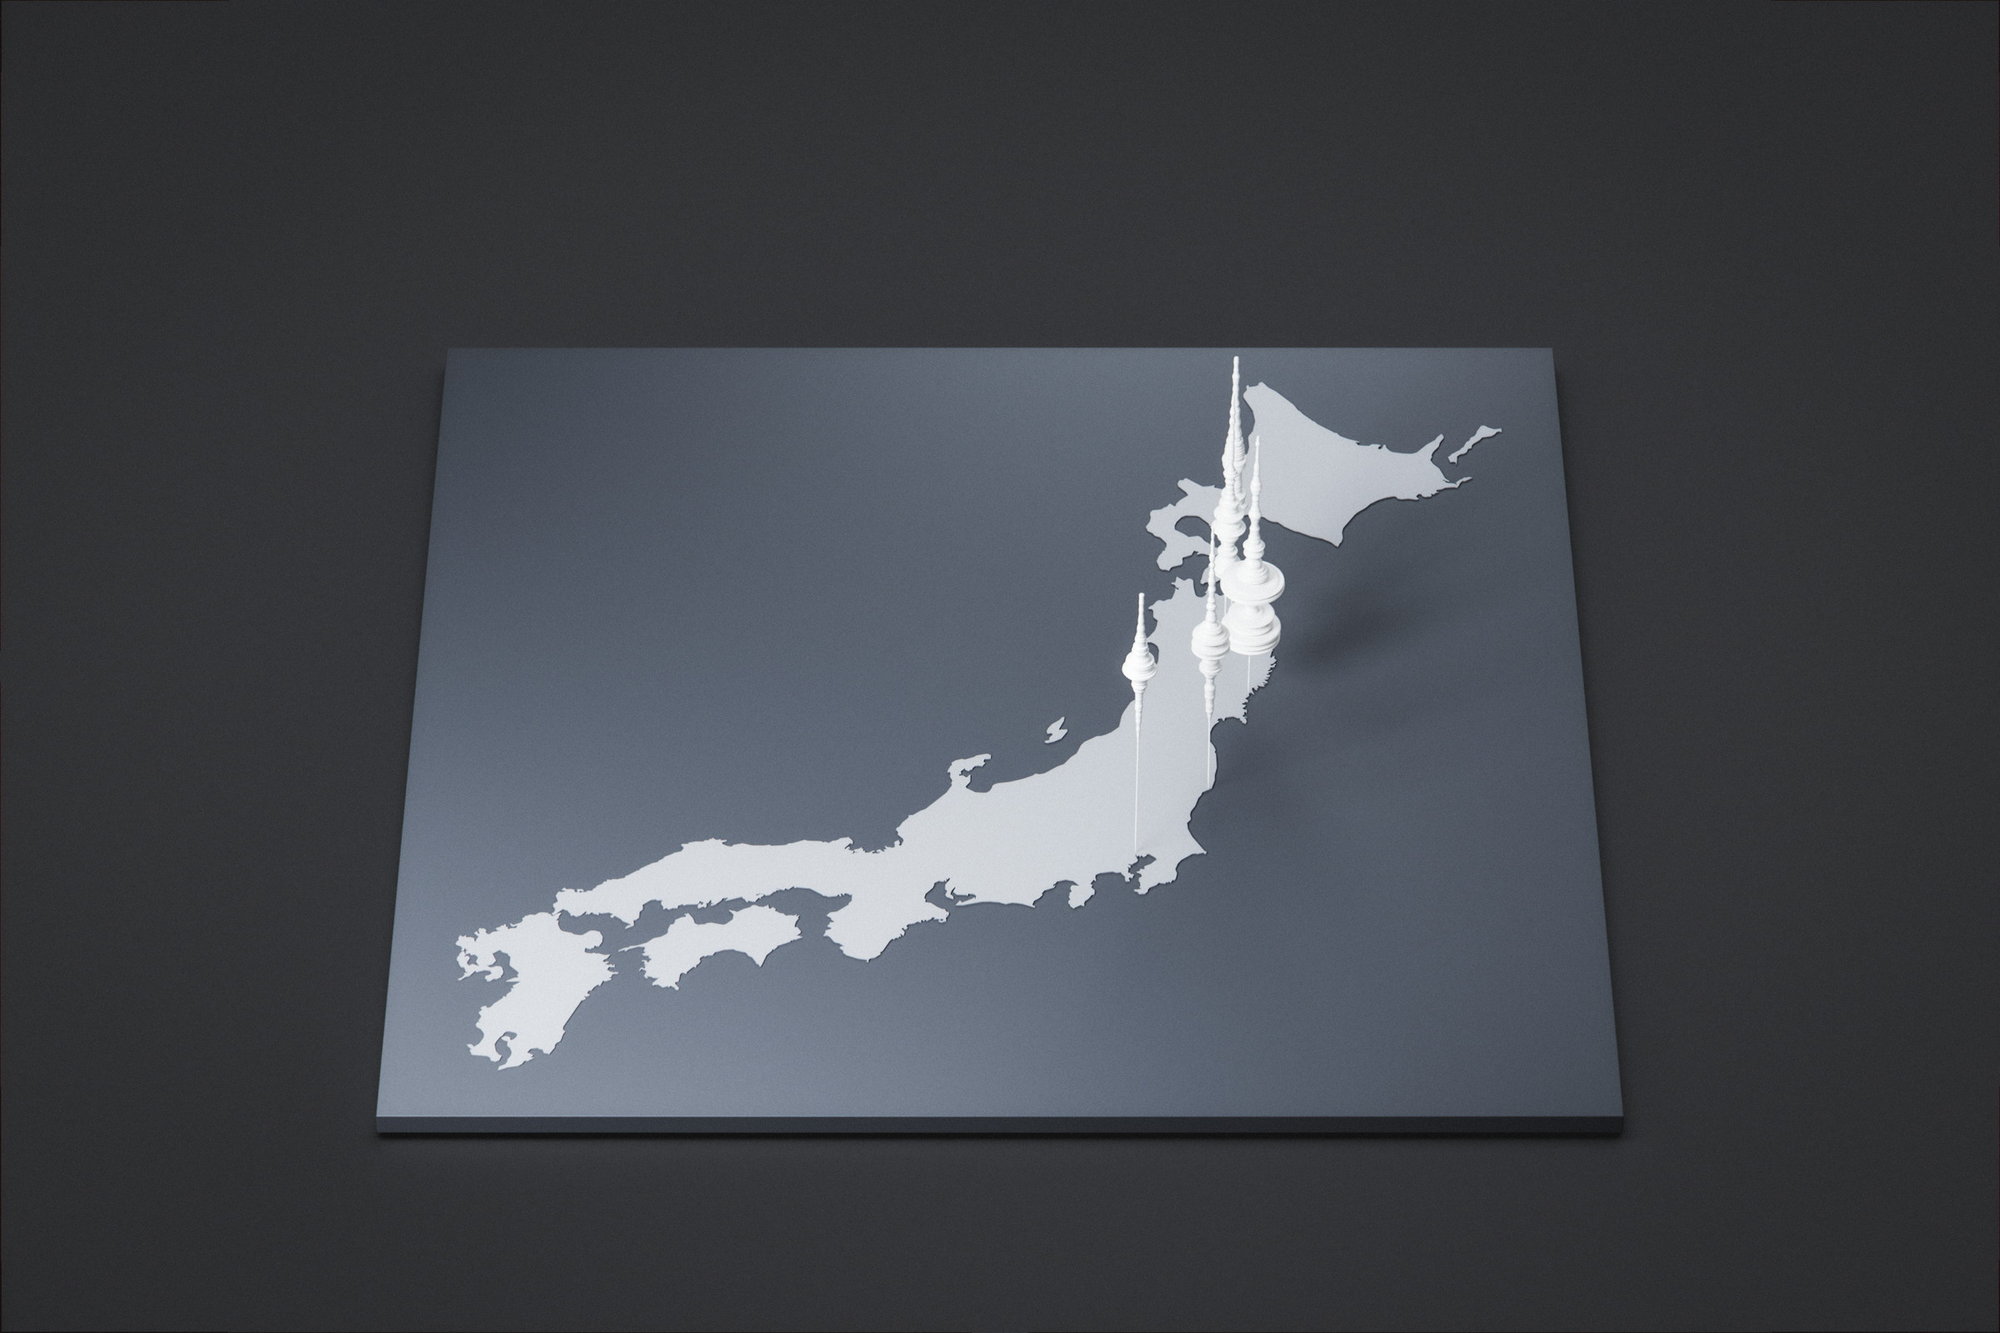
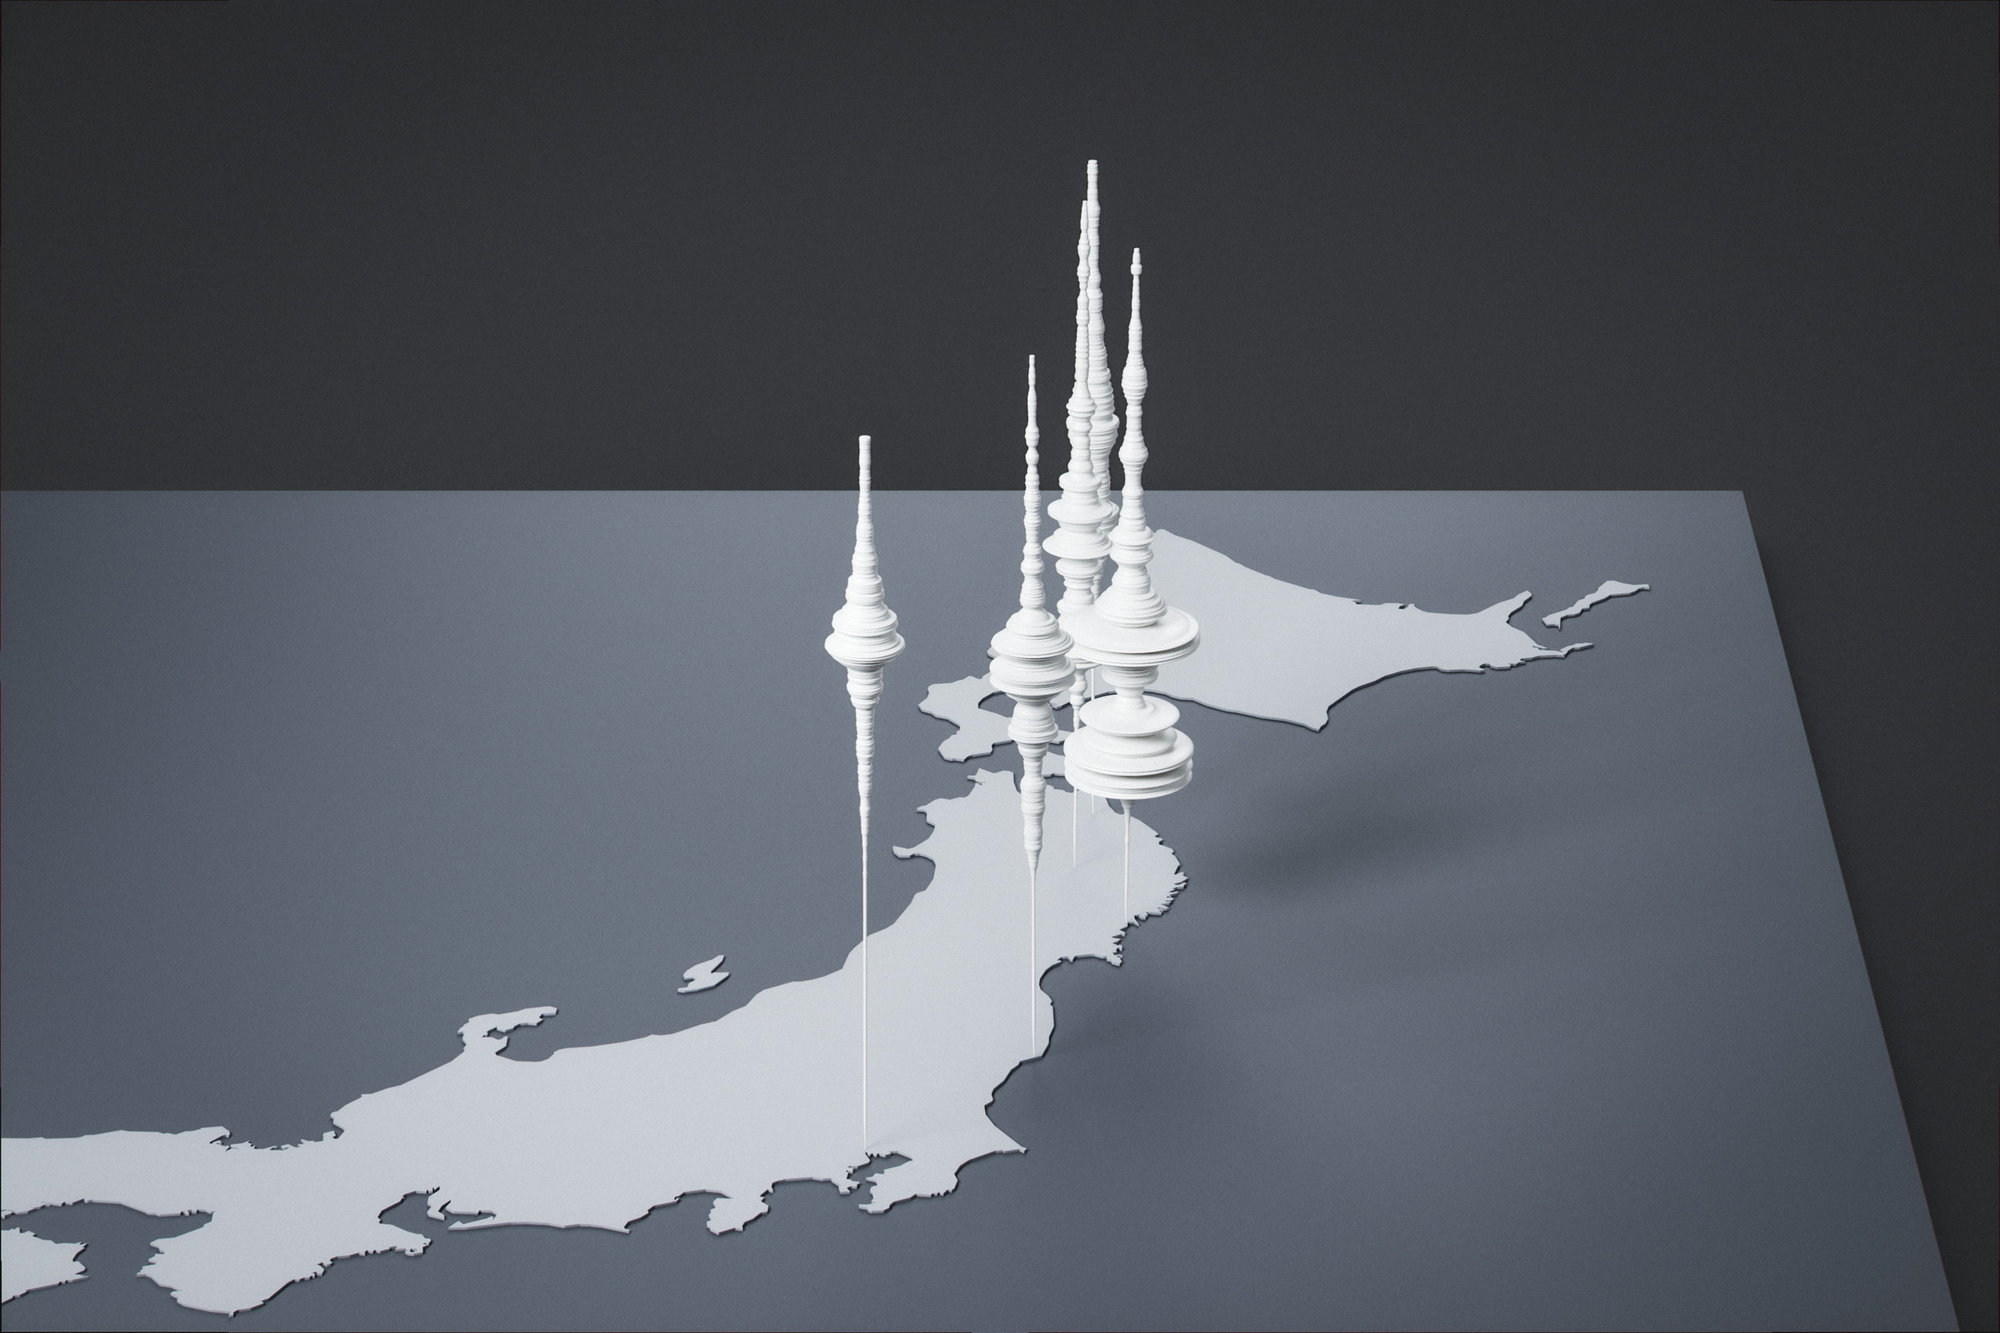
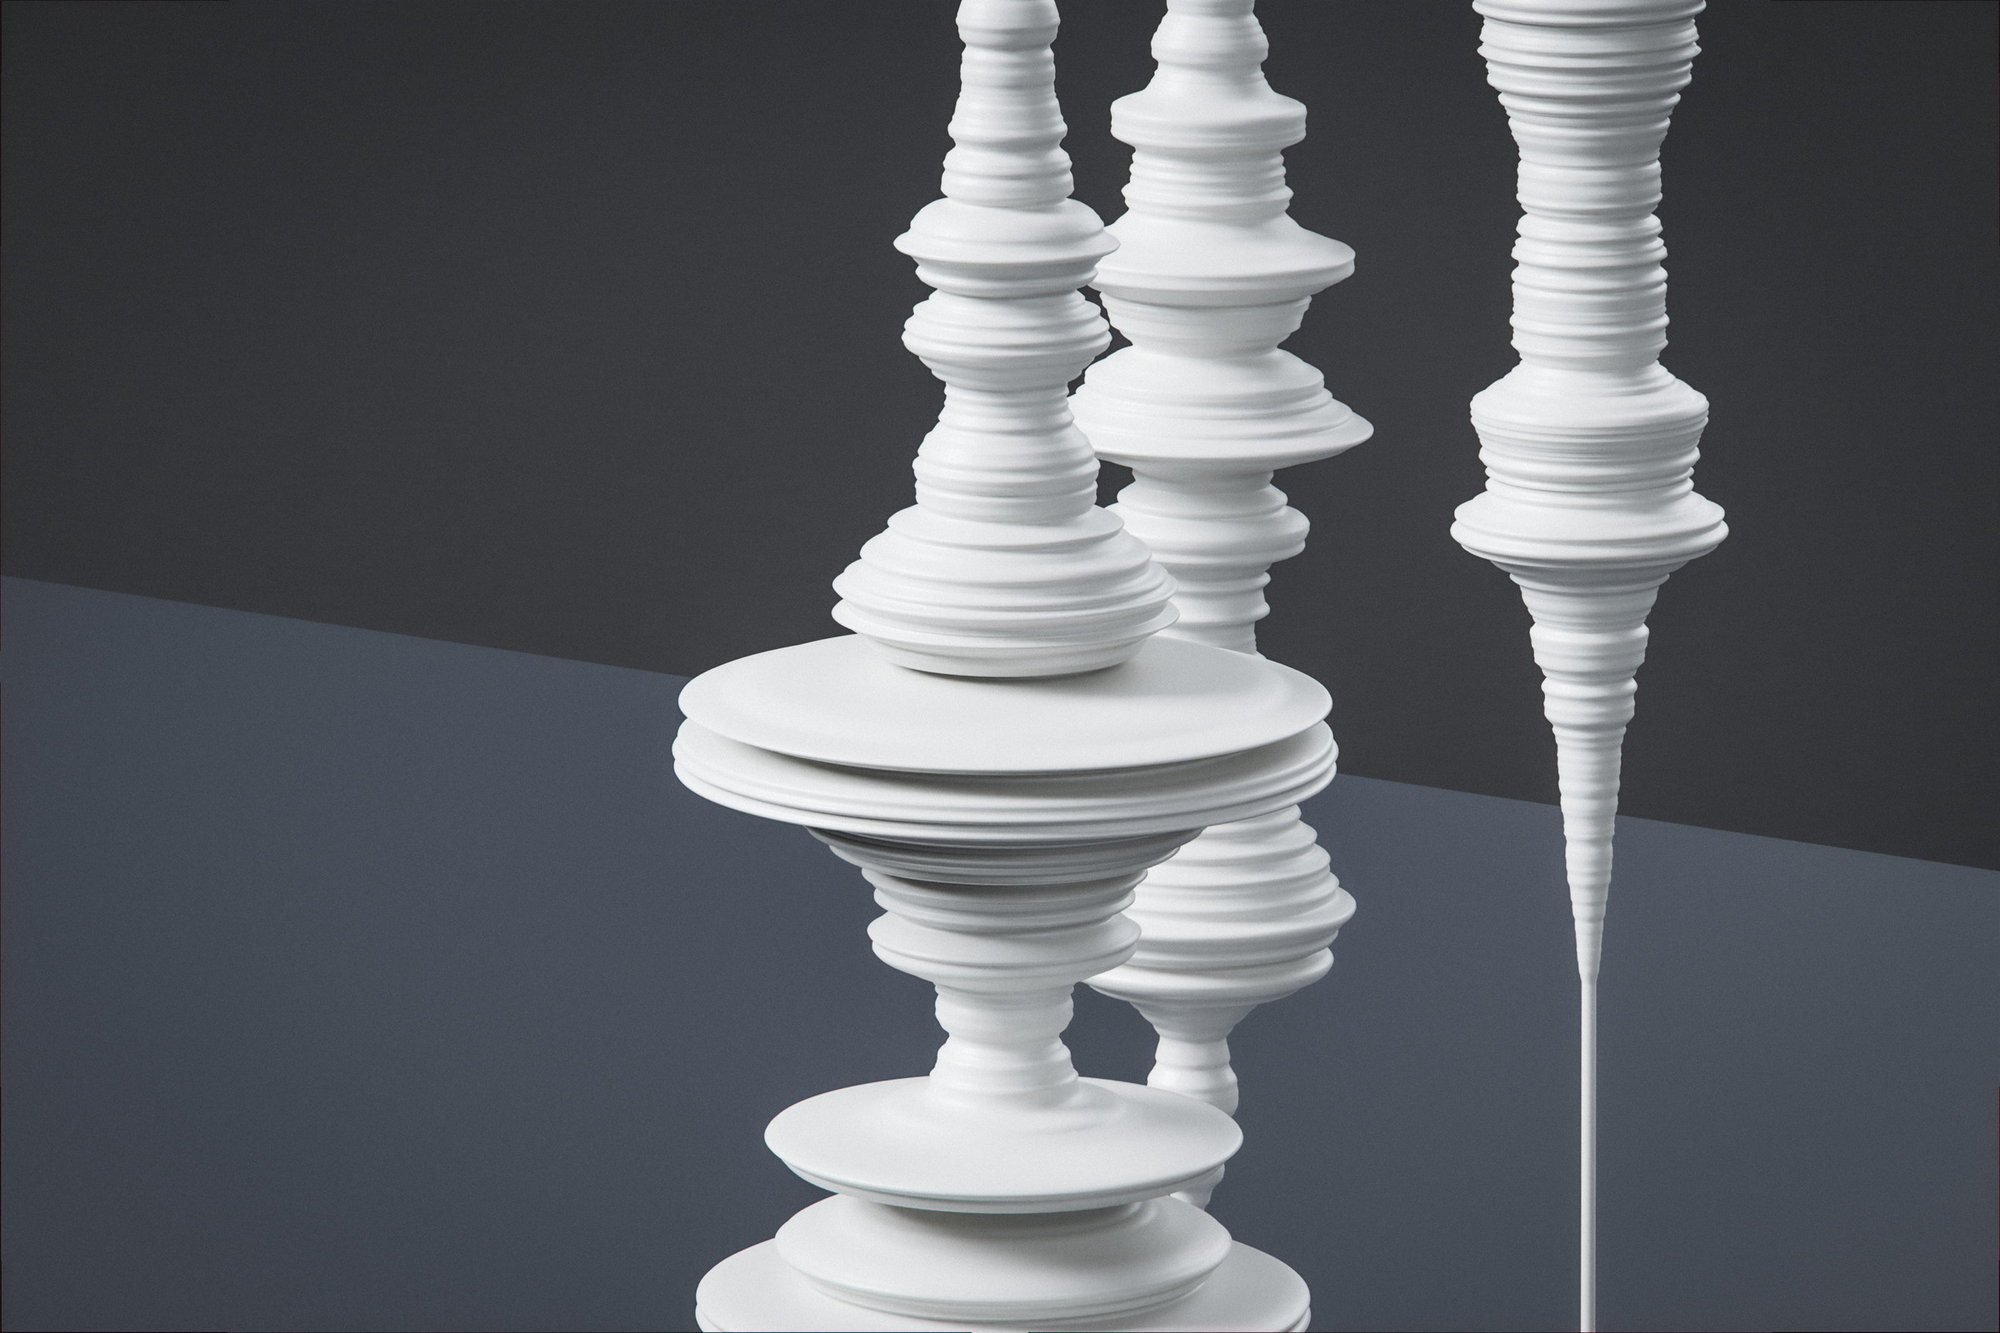
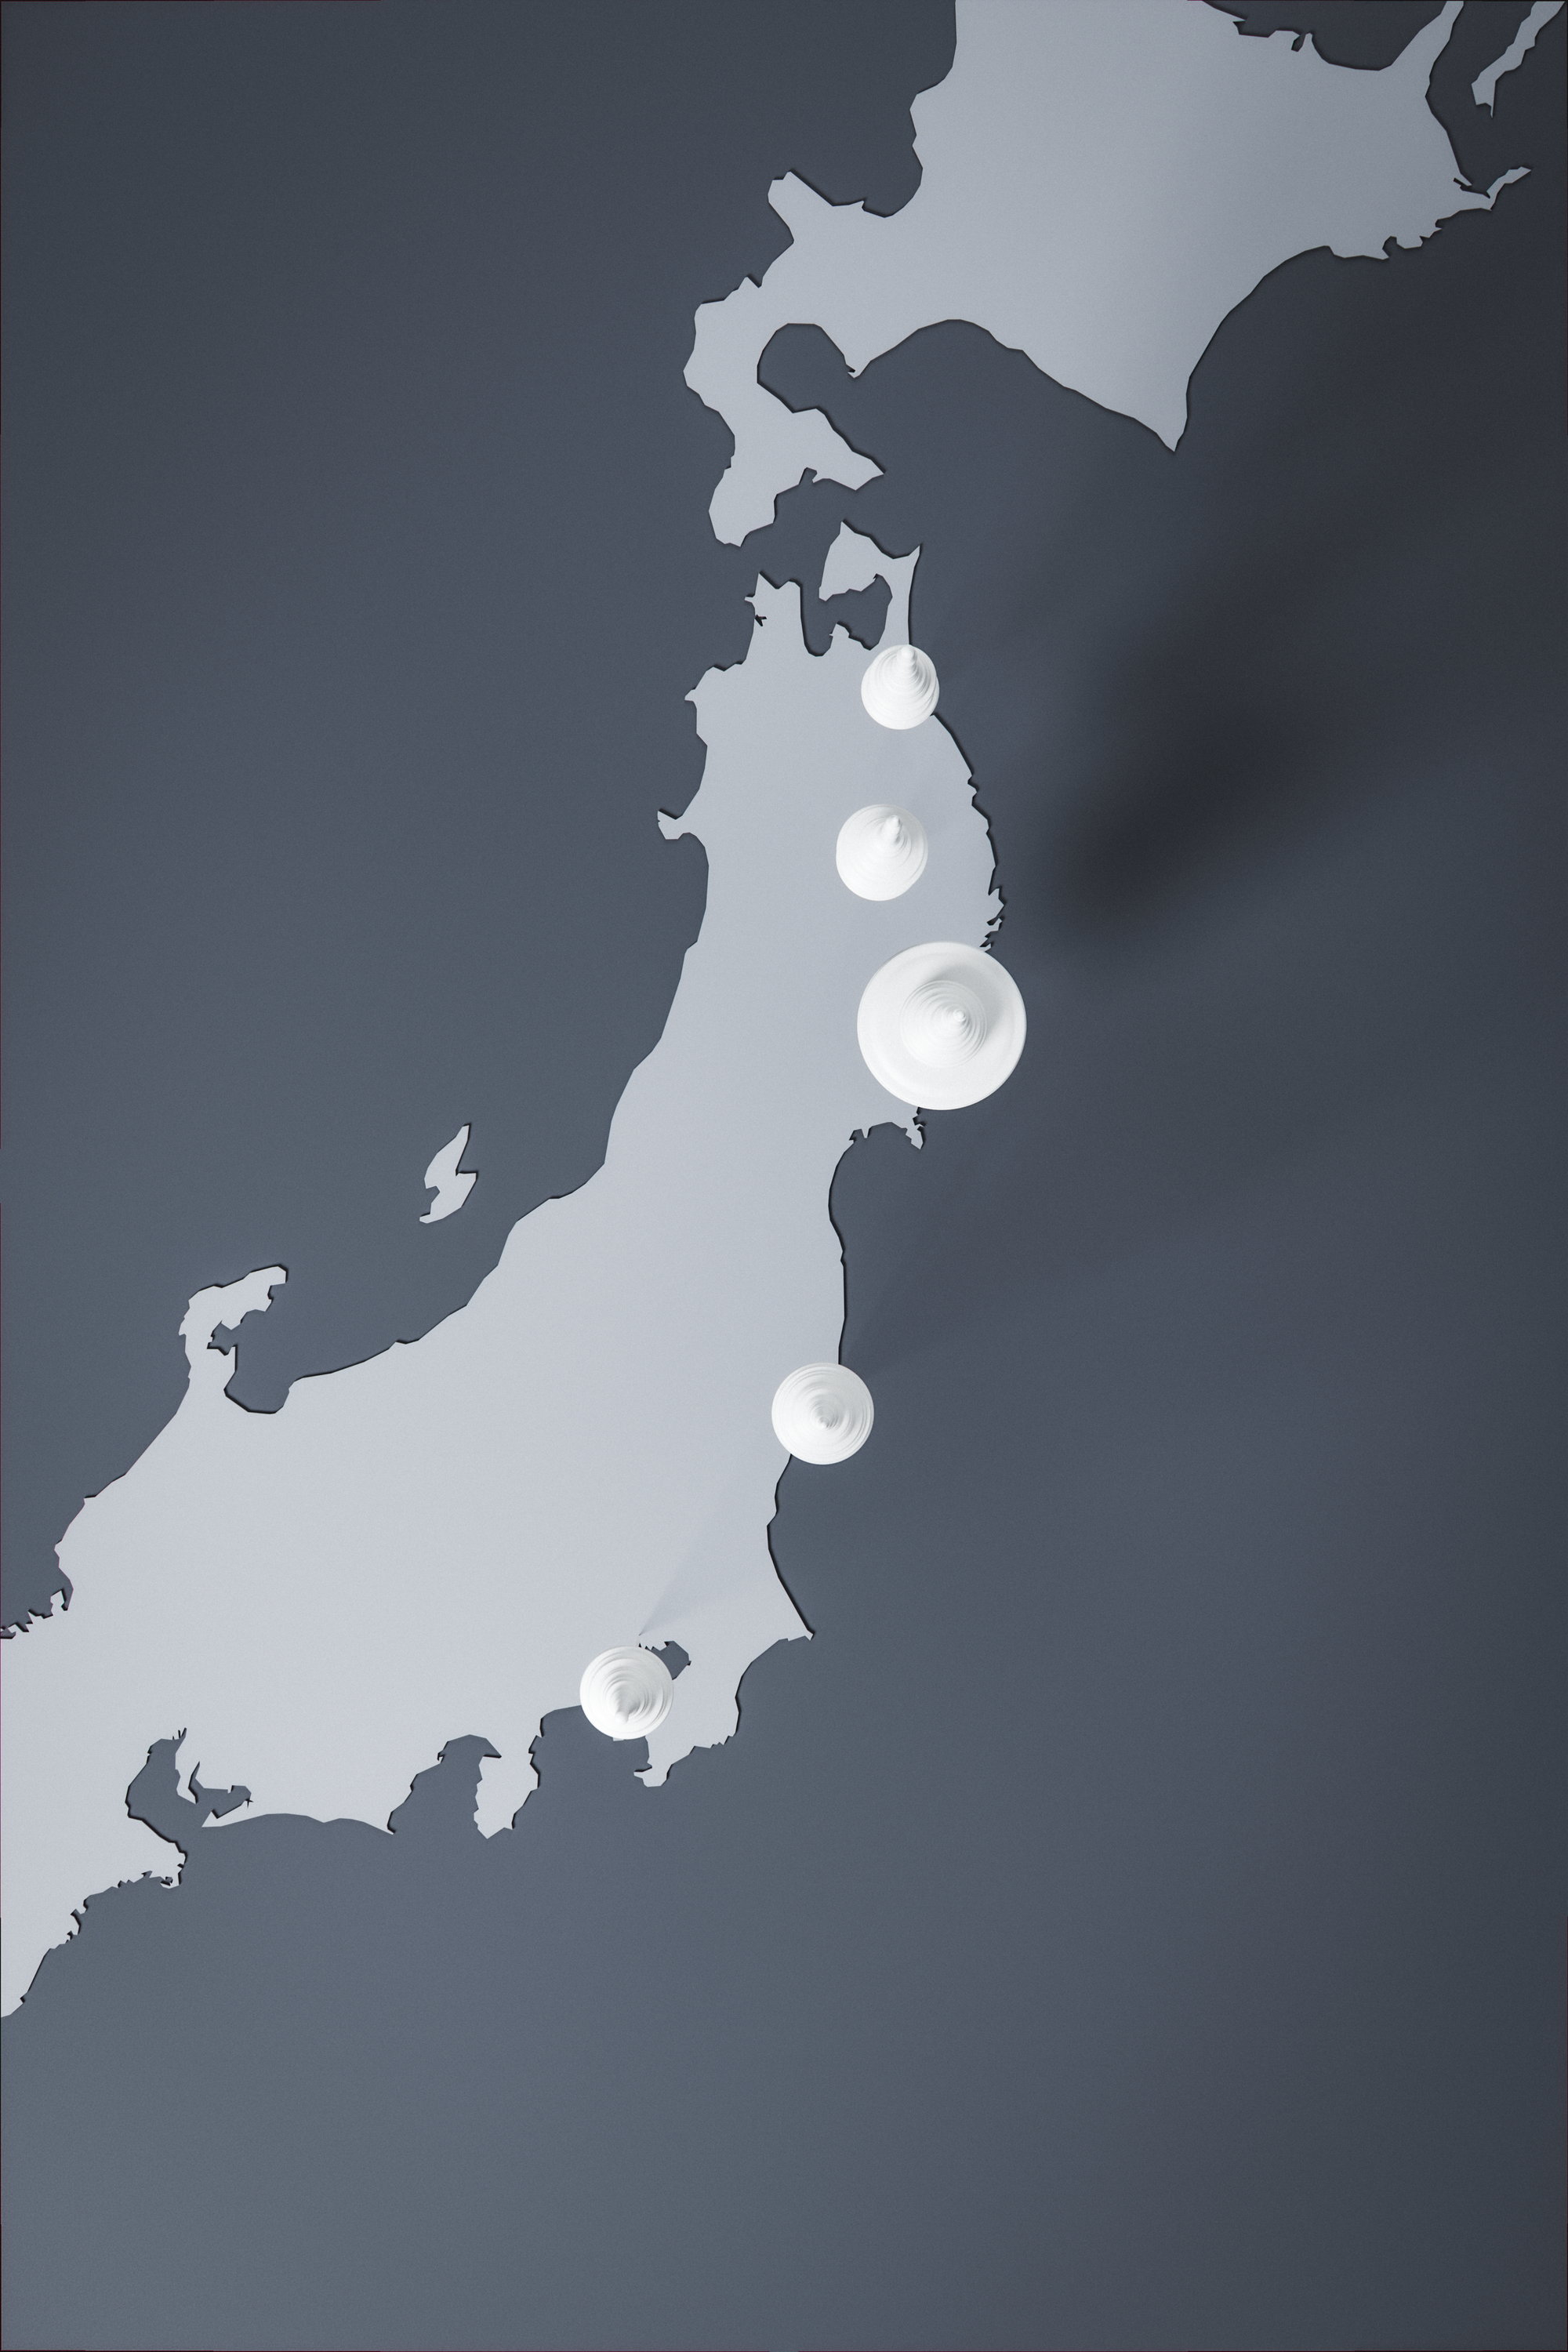
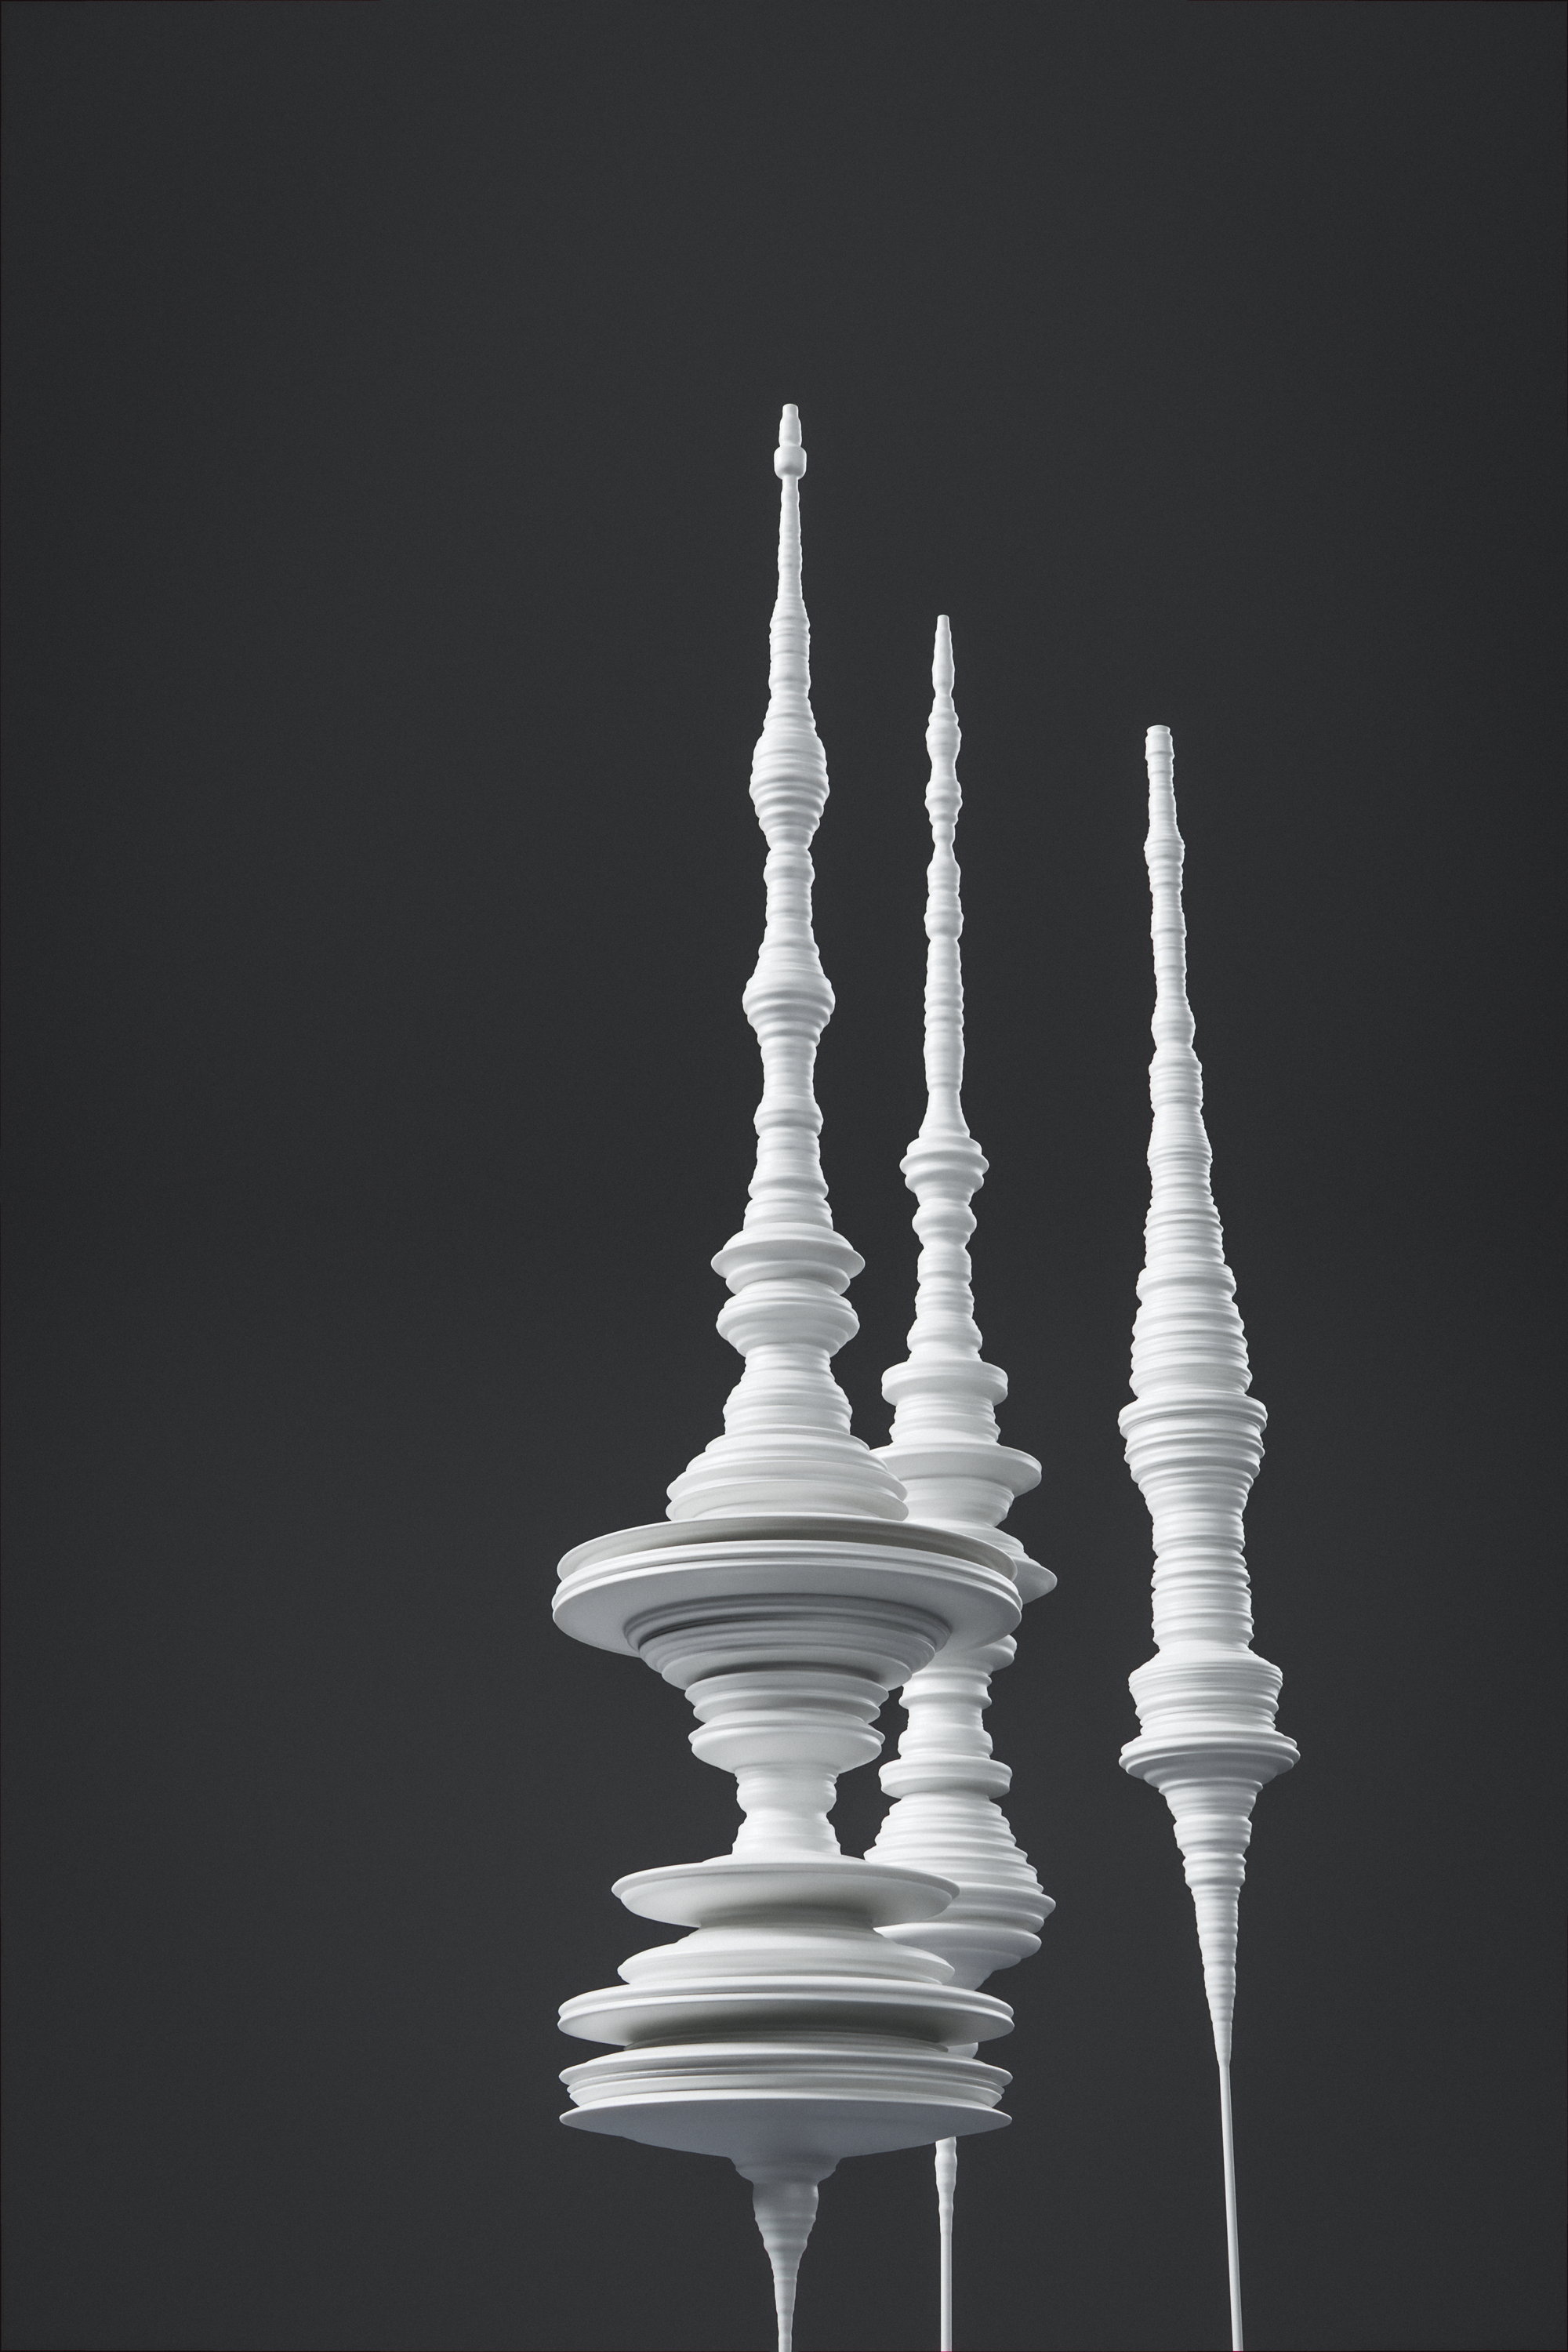
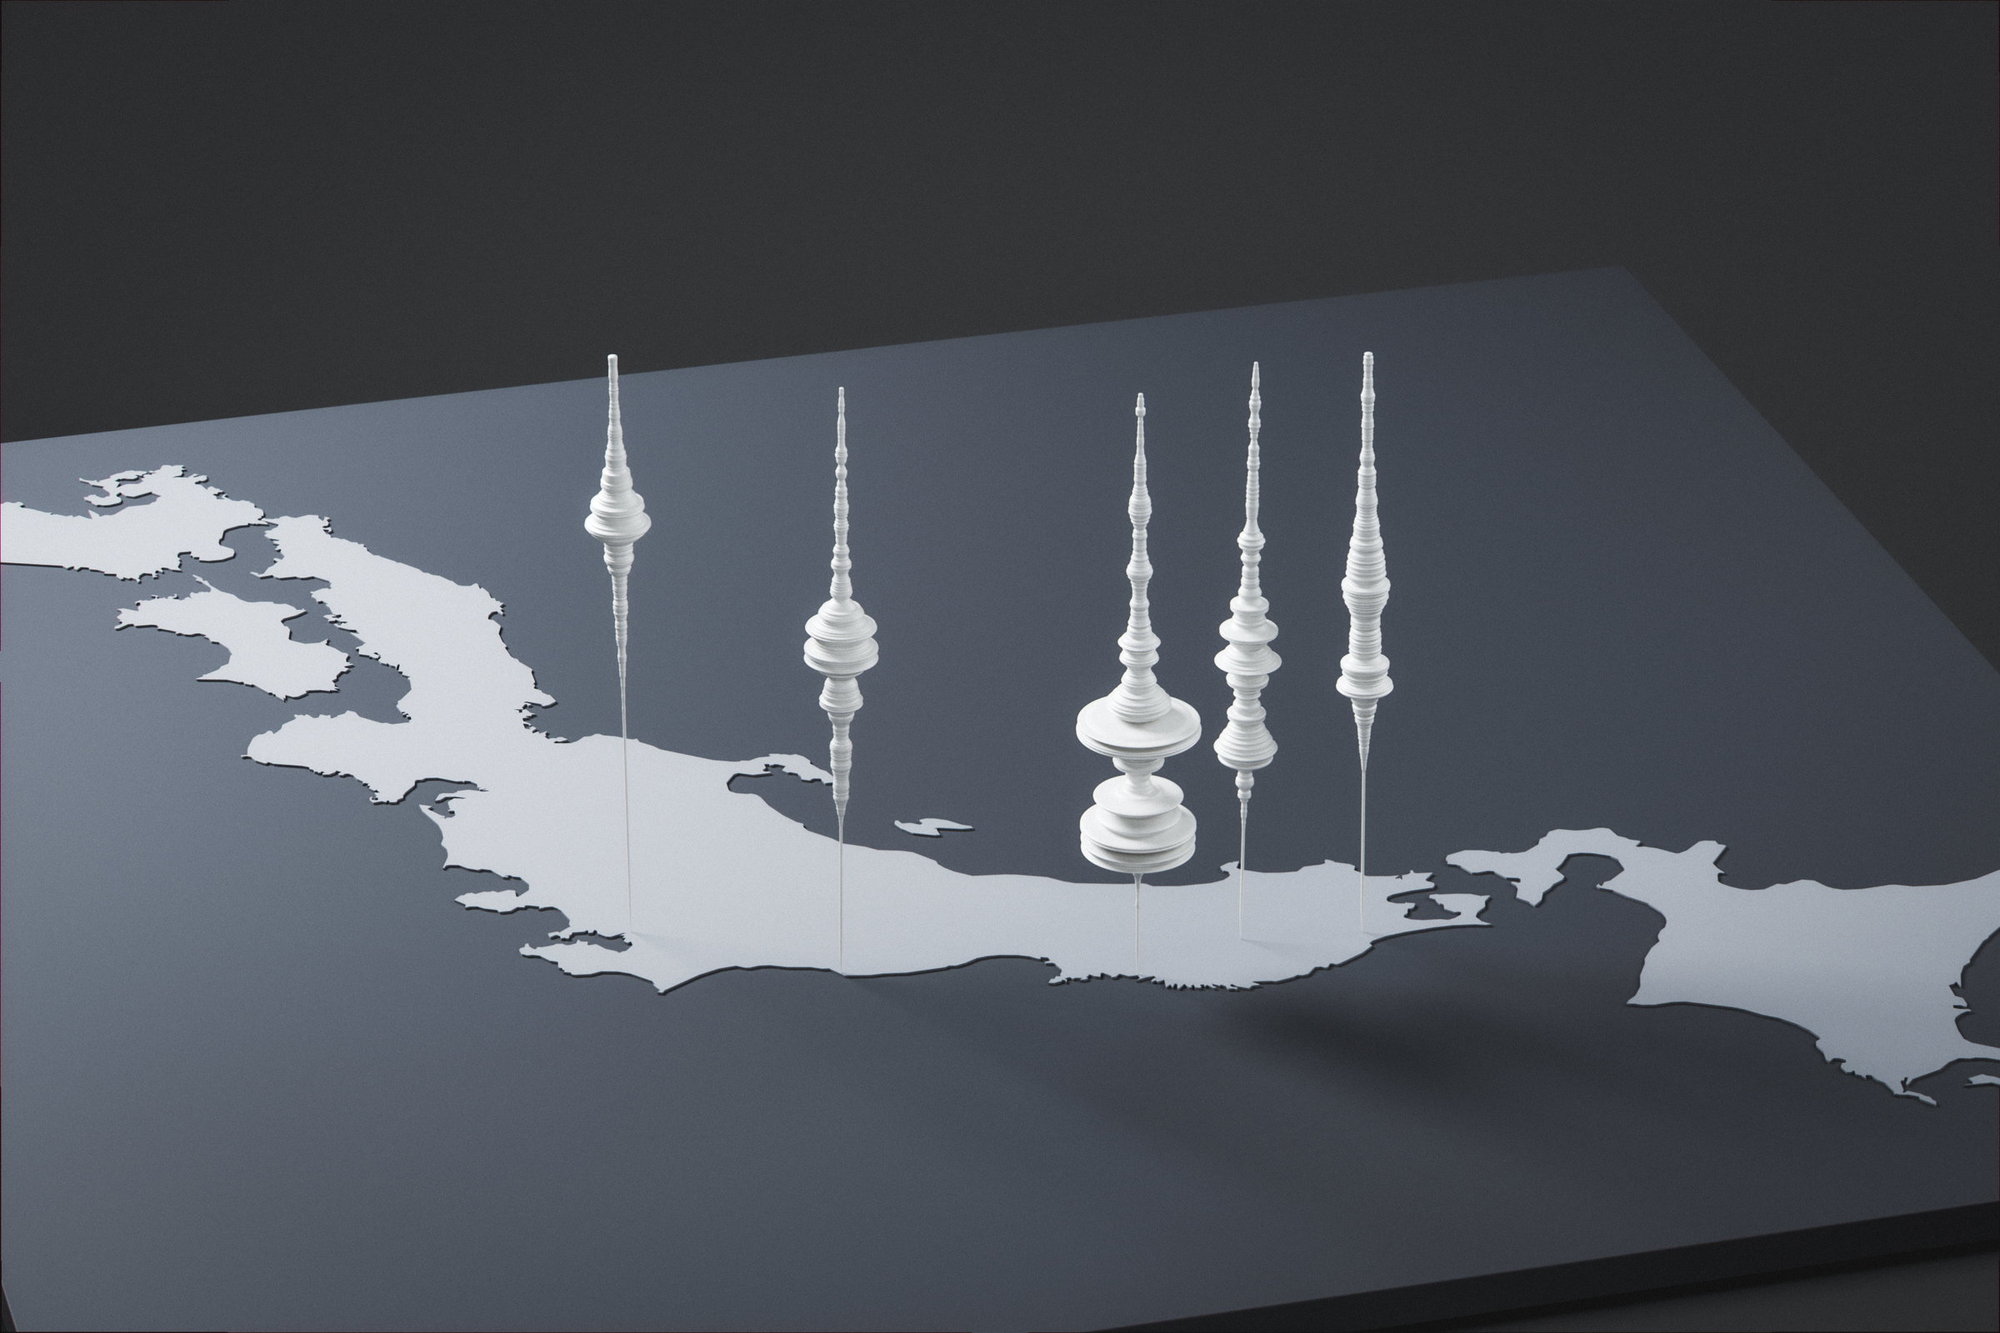
地震計の記録は、紙の上では一本の線です。複数の記録を比べるには、グラフを順に読むことになります。この作品は、2011年東北地方太平洋沖地震の加速度記録を回転体として立体化し、それぞれを観測点の位置に立てたものです。
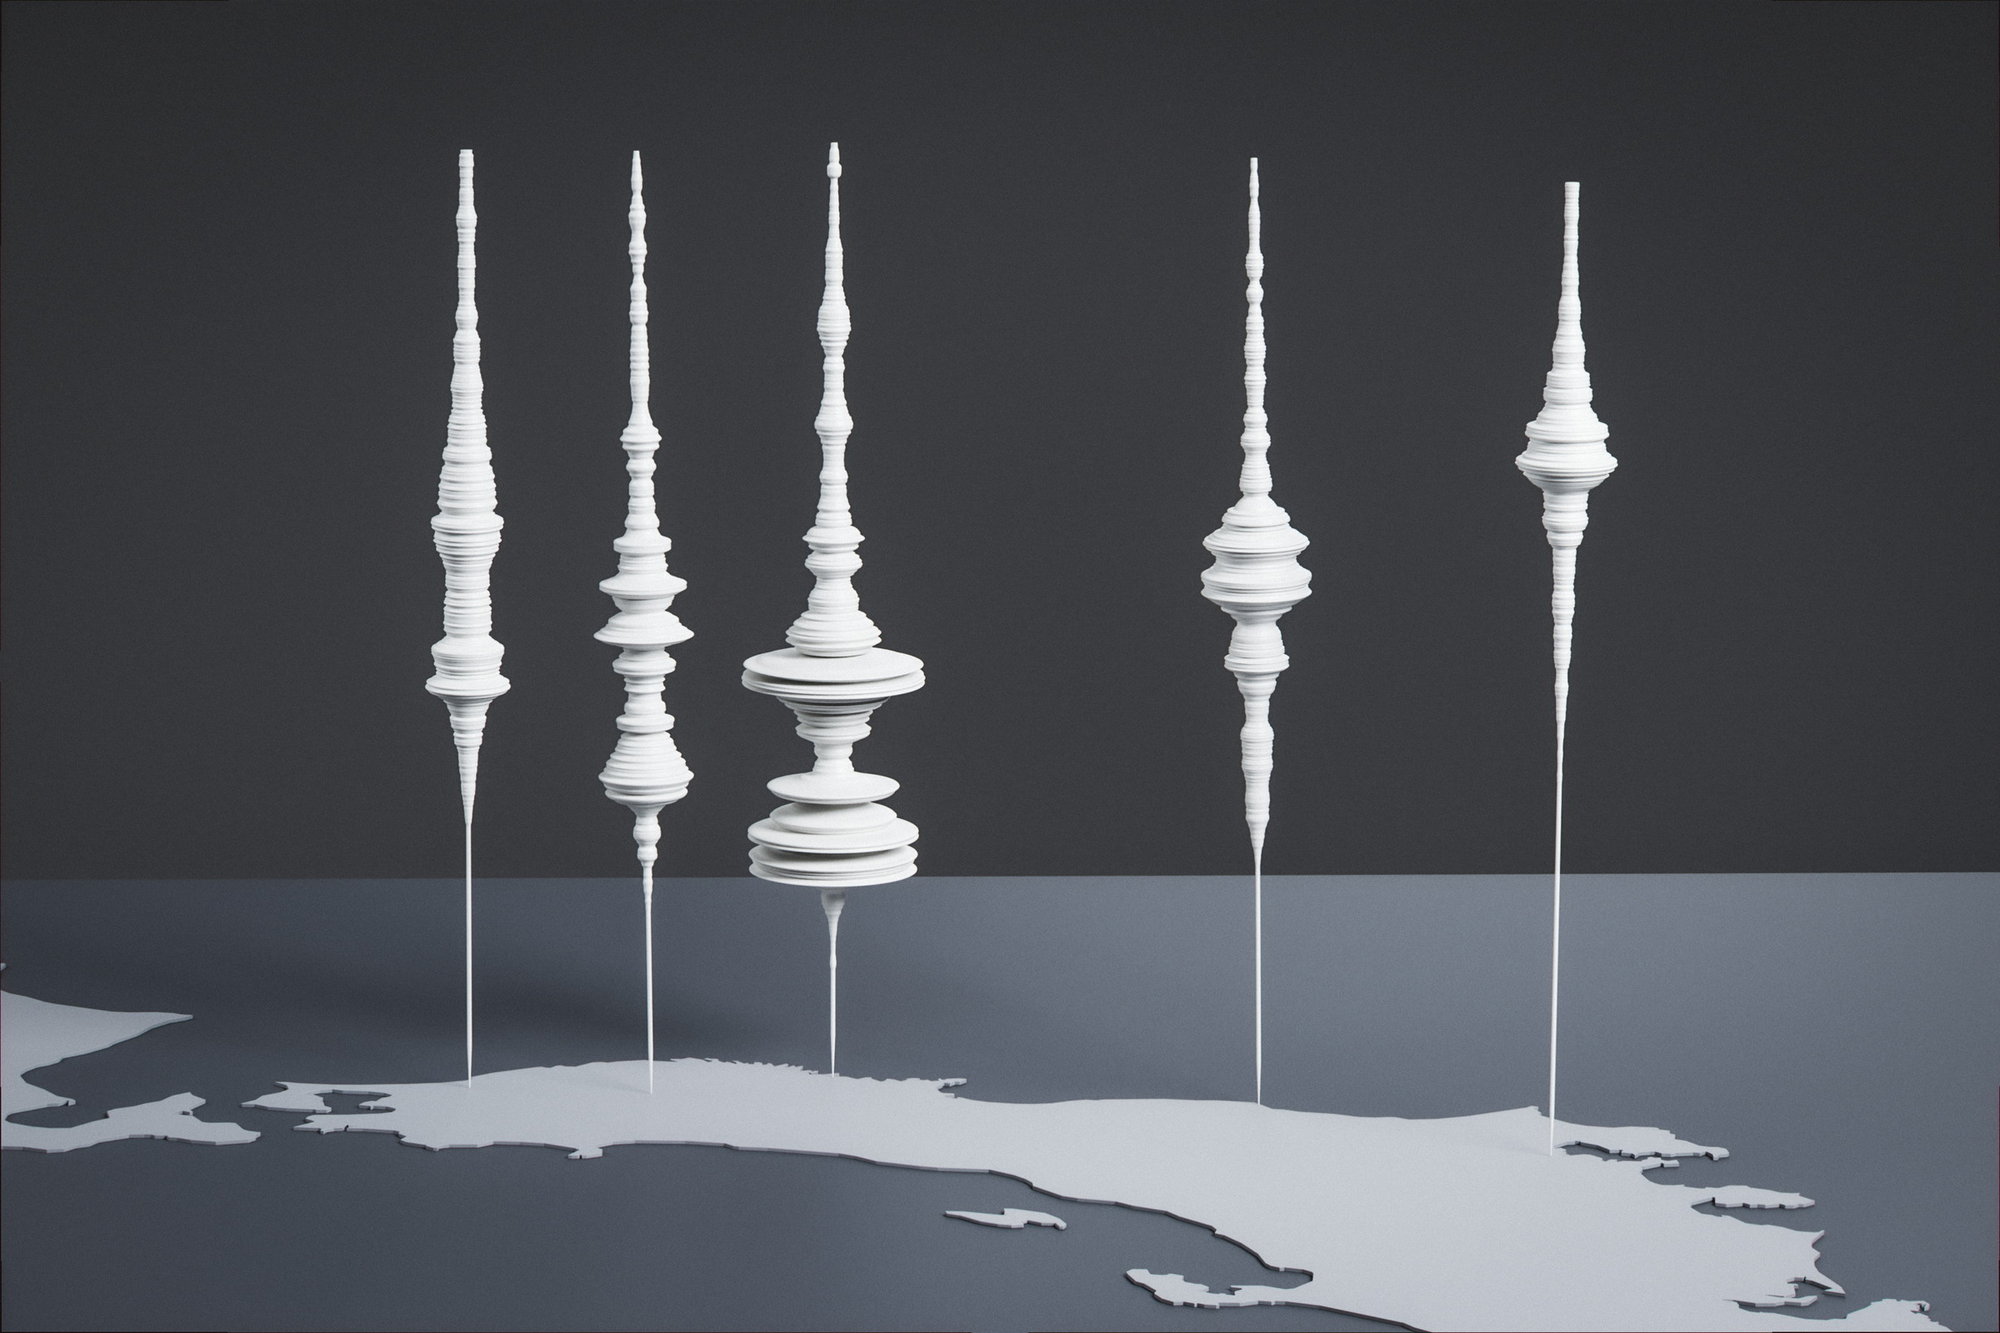
台座は震央を中心にした正距方位図法の日本列島で、震央からの距離が台座の上の距離と一致します。震央距離141 kmの宮城・気仙沼市赤岩は最大684.1 galで最も太い柱になり、385 kmの東京・千代田区大手町は259.4 galで細い尖塔になります。
5本を並べることで、距離による減衰をグラフを読まずに太さの違いとして見られるようにしました。
Comparing seismograms on paper means reading the graphs one after another. This work turns the acceleration records of the 2011 Tohoku earthquake into solids of revolution and stands each one at the observation point that produced it.
The base is the Japanese archipelago drawn in an azimuthal equidistant projection centred on the epicentre, so distance from the epicentre is preserved as distance on the base. Kesennuma Akaiwa in Miyagi, 141 km from the epicentre, peaks at 684.1 gal and becomes the thickest column; Otemachi in Tokyo, at 385 km, peaks at 259.4 gal and thins to a spire.
Standing five of them together makes attenuation with distance visible as a difference in thickness rather than as a curve to be read.
Details
2024年4月 – 5月
使用ソフト:Python / Houdini / Blender
April – May 2024
Software: Python / Houdini / Blender
References
防災科学技術研究所 強震観測網 K-NET https://www.kyoshin.bosai.go.jp/
Strong-motion seismograph network K-NET, National Research Institute for Earth Science and Disaster Resilience. https://www.kyoshin.bosai.go.jp/